
Published 30 October 2023 I Australian Government I Jobs and Skills Australia
The Australian Labour Market for Migrants publication provides information on the Australian labour market. It is intended to inform recent migrants to Australia, people interested in working in Australia on a temporary or permanent basis, and organisations providing services to migrants and potential visa applicants.
Australia’s labour market conditions were strong over 2022-23 with continuing strong demand from employers and growth in labour supply. However, weaker economic growth and other forward indicators, suggest the Australian labour market is softening and will likely experience subdued conditions over the period ahead. See the Jobs and Skills Australia website for recent labour market data and analysis. Unless otherwise stated, data in this publication are from the Australian Bureau of Statistics (ABS) Labour Force Survey, August 2023.
Employment
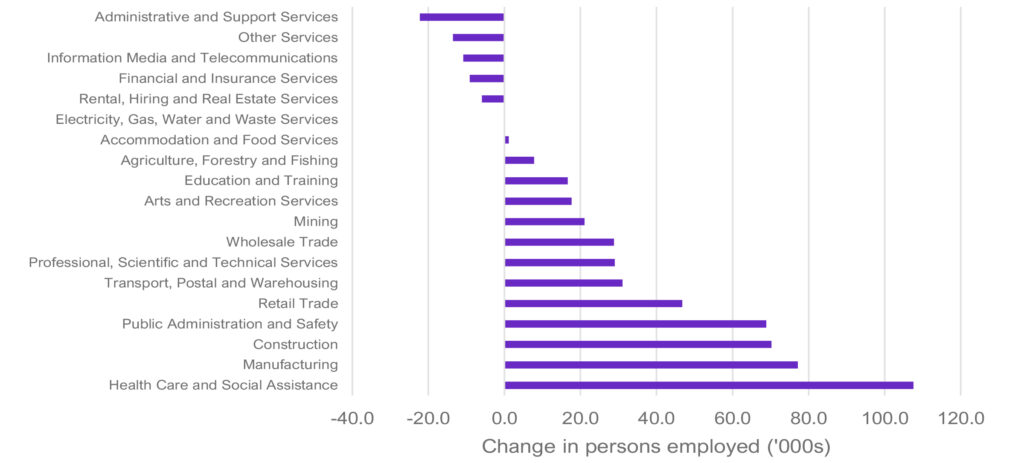
Over the 12 months to August 2023, employment opportunities and growth varied widely across industries. The largest increases in trend employment occurred in Health Care and Social Assistance (up by 107,600), Manufacturing (up by 77,200) and Construction (up by 70,300). The largest decreases in employment occurred in Administrative and Support Services (down by 22,200), Other Services (down by 13,500) and Information Media and Telecommunications (down by 10,800). Changes in employment by industry are shown in Figure 1. The strongest rates of employment growth were in Manufacturing (up by 8.9%), Wholesale Trade (up by 8.0%) and Public Administration and Safety (up by 7.9%).
Figure 1: Employment growth by industry (’000s persons) — August 2022 to August 2023
trend data. Retrieved September 21, 2023. https://www.abs.gov.au/statistics/labour/employment-andunemployment/
labour-force-australia-detailed/latest-release
Occupation by state/territory
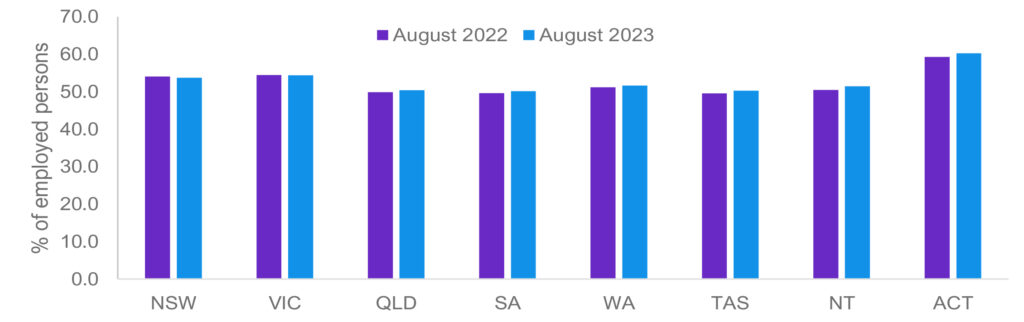
Figure 2 shows that in August 2023 (trend data2), the Australian Capital Territory (ACT) had the highest share (60.3%) of employed workers in selected occupation groups (i.e. Managers, Professionals, and Technicians and Trade Workers), followed by Victoria (54.4%) and New South Wales (NSW, 53.7%).
In the 12 months to August 2023, the share of workers employed in these selected occupation groups increased in all states and territories except in NSW (down by 0.4pp3) and Victoria (unchanged). The largest increases were in the Northern Territory (NT, up by 1.0pp), the ACT (up by 1.0pp) and Tasmania (up by 0.7pp). Increases of 0.5pp were observed in the remaining states, South Australia (SA), Western Australia (WA) and Queensland.
Figure 2: Share of employment in selected Occupation Groups4 by state/territory, August 2022 and 2023
Unemployment
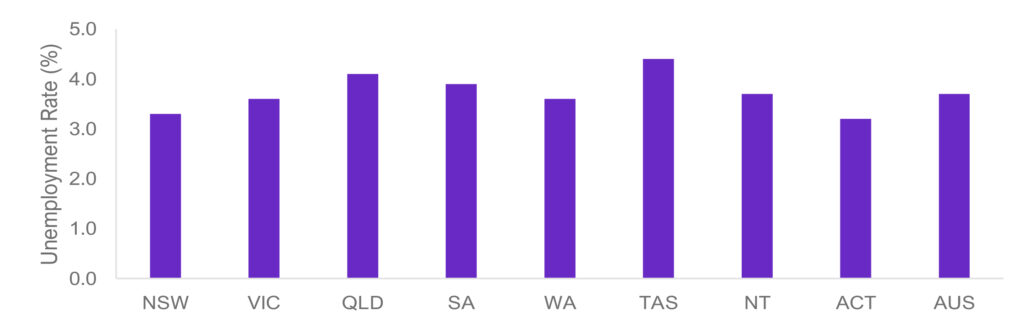
The trend unemployment rate in Australia was 3.7% in August 2023, compared with 3.5% in August 2022.
Over the 12 months to August 2023, the unemployment rate decreased in SA (4.2% to 3.9%) and NT (3.9% to 3.7%). The unemployment rate rose in Queensland (3.6% to 4.1%), Tasmania (4.0% to 4.4%), WA (3.3% to 3.6%) and ACT (3.1% to 3.2%). The unemployment rate remained the same in NSW (3.6%) and Victoria (3.3%). The ACT recorded the lowest unemployment rate at 3.2% and Tasmania had the highest unemployment rate at 4.4%. See Figure 3.
Figure 3: Unemployment rates (%) by state/territory — August 2023
September 21, 2023. https://www.abs.gov.au/statistics/labour/employment-and-unemployment/labour-forceaustralia/
feb-2023.
Migrant Employment
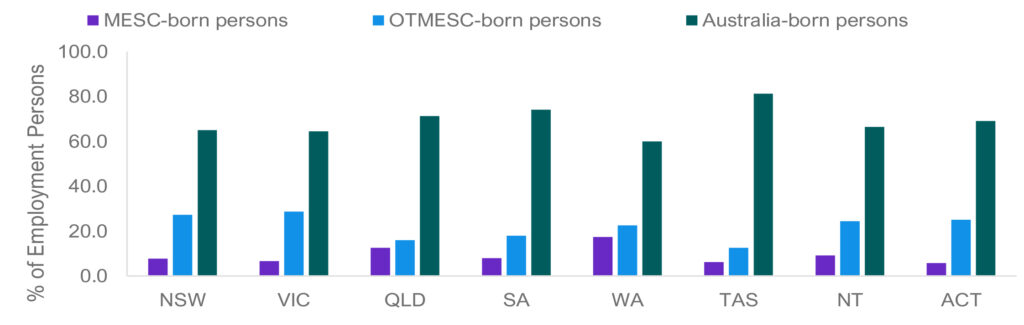
Australian-born people represent the highest share of employed people in Tasmania (81.2%) and the lowest share in WA (60.0%). The share of employed people born in other than main English-speaking countries (OTMESC)5 is highest in Victoria and the ACT (28.8% and 27.3% of workers, respectively). See Figure 4.
Figure 4: Share of employment by state/territory and place of birth, August 2023
main English-speaking countries, sex, state and territory. Retrieved September 21, 2023.
https://www.abs.gov.au/statistics/labour/employment-and-unemployment/labour-force-australia-detailed/latest-release
Migrant Unemployment
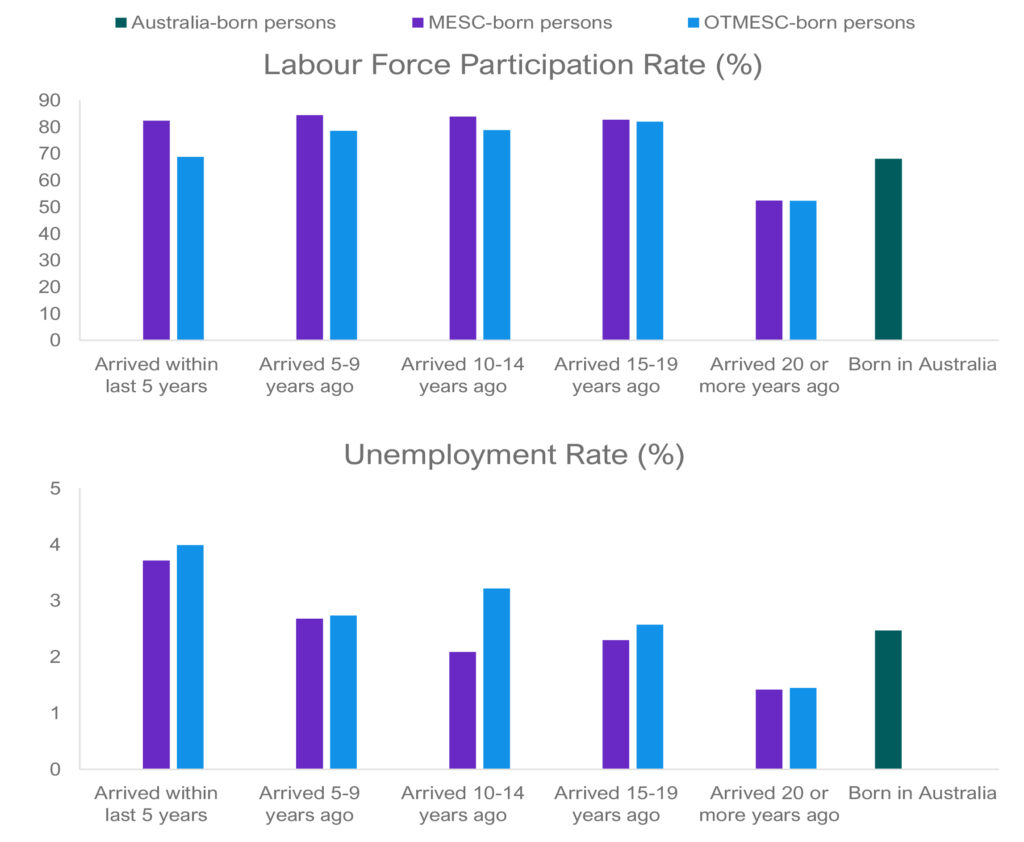
The unemployment rates for people who migrate to Australia vary appreciably. Several factors influence migrant unemployment rates including skill level, age, English language proficiency, recent and relevant work experience and the period since arrival in Australia. Data consistently shows that recently arrived migrants have a higher unemployment rate on average than those who have lived in Australia for some years. Figure 5 shows the participation and unemployment rates of the Australian-born and migrants by broad country of birth groups and period of residence in Australia (average of the last 12 months to August 2023).
Figure 5: Labour force participation rate and unemployment rate, by years since arrival in Australia for
broad country of birth groups — 12 months to August 2023 average
main English-speaking countries, sex, state and territory. Retrieved September 21, 2023.
https://www.abs.gov.au/statistics/labour/employment-and-unemployment/labour-force-australia-detailed/latest-release
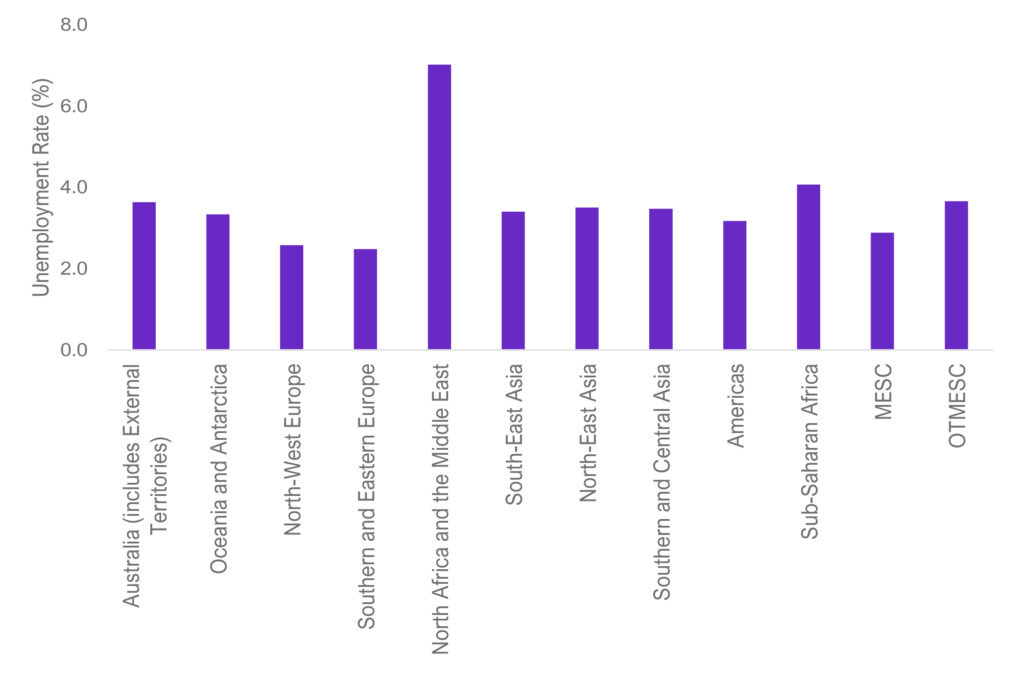
Figure 6 shows unemployment rates (average of the last 12 months to August 2023) for people resident in Australia by their major birth country groups (by subcontinent). People born in Southern and Eastern Europe had the lowest unemployment rate (at 2.5%), while the unemployment rate for people born in North Africa and the Middle East (7.0%) was relatively high (possibly reflecting English language proficiency and period of residence in Australia).
Figure 6: Labour force participation rate and unemployment rate, by years since arrival in Australia by
broad country of birth groups — 12 months to August 2023 average
(subcontinent) of birth (SACC) and sex; and Table LM7: Labour force status by elapsed years since arrival, main Englishspeaking
countries, sex, state and territory. Retrieved September 21, 2023.
https://www.abs.gov.au/statistics/labour/employment-and-unemployment/labour-force-australia-detailed/latest-release.
Employment by occupation
Over the 12 months to August 2023, the largest increases in employment (trend data7) occurred for Professionals (up by 129,700), Community and Personal Service Workers (up by 83,900) and Technicians and Trades Workers (up by 54,500). The smallest increase occurred for Machinery Operators and Drivers (up by 24,300). Employment growth for the major occupation groups is shown in Table 1.
Table 1: Trend employment growth by occupation — 12 months to August 2023
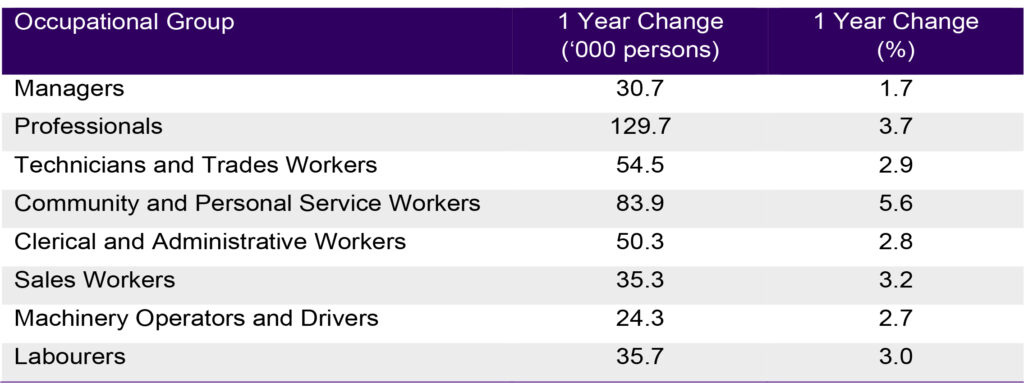
Additional information on occupational groups is provided in the following section on internet vacancy data.
Internet vacancy data
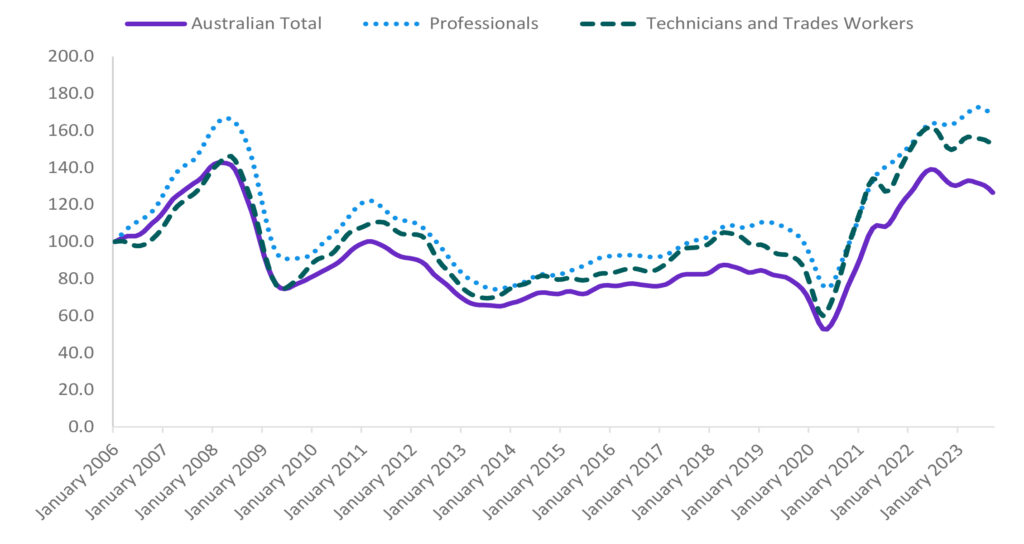
Jobs and Skills Australia produces the monthly Vacancy Report which contains the Internet Vacancy Index (IVI), see Figure 7. Over the year to August 2023, the trend IVI increased only for Professionals (up by 3.8%). Decreases were seen in all other occupation groups: Labourers (down by 28.2%), Sales Workers (down by 13.7%), Community and Personal Service Workers (down by 11.6%), Clerical and Administrative Workers (down by 10.2%), Machinery Operators and Drivers (down by 7.7%), Technicians and Trades Workers (down by 2.8%) and Managers (down by 2.1%).
At the more detailed occupation level, trend vacancies increased in 13 of the 48 occupation clusters over the year to August 2023, with the strongest increases for Medical Practitioners and Nurses (up by 33.2%), Health Diagnostic and Therapy Professionals (up by 29.2%), and Education Professionals (up by 23.7%). The largest decreases were for Food Preparation Assistants (down by 55.0%), Cleaners and Laundry Workers (down by 35.6%) and Food Trades Workers (down by 31.1%).
Over the year to August 2023, trend vacancies increased in the NT (up by 11.7%) and Tasmania (up by 3.3%). Vacancies fell in Victoria (down by 10.5%), NSW (down by 8.9%), SA (down by 3.0%), WA (down by 2.1%), the ACT (down by 1.9%) and Queensland (down by 1.7%). For a full list of occupations and their recent growth in vacancies, see the Vacancy Report and supporting data files.
Figure 7: Internet Vacancy Index, January 2006 to August 2023
Further Information
Queries on the Australian Labour Market for Migrants publication, including requests for inclusion on the distribution list and copies of Hot Topics attached to previous editions, should be emailed to migration@jobsandskills.gov.au.
Hot Topic: Graduate labour market outcomes
This Hot Topic provides an overview of the medium-term labour market outcomes of international and domestic graduates10,11 of higher education institutions in Australia. Unless otherwise stated, data are sourced from the latest data available, the 2022 Quality Indicators for Learning and Teaching survey (QILT) and the 2022 Longitudinal Graduate Outcomes Survey (GOS-L).12,13,14 This analysis compares outcomes for students who completed their course approximately three years earlier.
Graduate education and employment
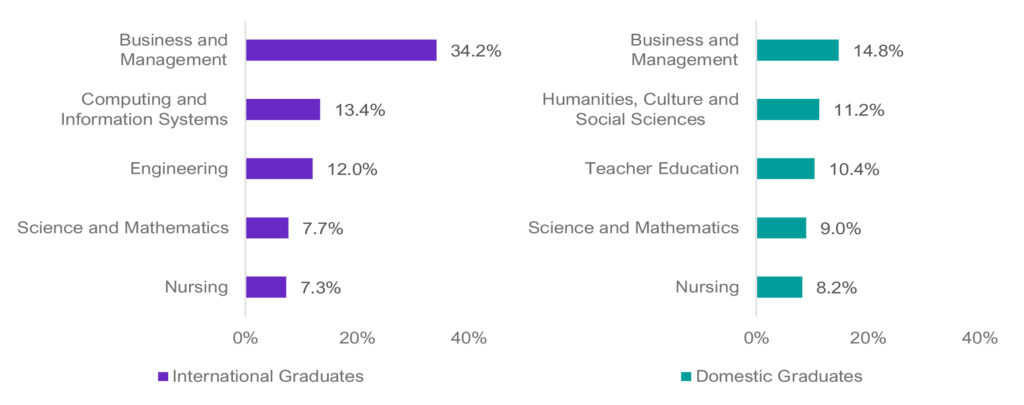
For survey respondents that finished their studies in 2019, Figure A compares the main study areas of international and domestic graduates of higher education institutions. It shows that Business and Management (34.2%) and Science Technology Engineering and Mathematics (STEM15, 33.1%) were the main study areas for international graduates. In comparison, 15.8% of domestic graduates studied in these STEM study areas. Dentistry and Tourism, Hospitality, Personal Services, Sport and Recreation were the smallest two study areas for both groups, representing less than 1% of graduates.
Figure A: Top 5 study areas of international graduates (left) and domestic graduates (right), percentage
of each cohort
Three years after graduating, 70.0% of domestic and 60.5% of international graduates worked as Professionals.17 The second most common occupation group for international graduates was Clerical and Administrative Workers (9.9%) and for domestic graduates was Managers (10.1%). The study areas with the highest international graduate employment rates were related to Health Care and Social Assistance (Table A). While over a third of international graduates studied Business and Management, this area of study had an employment rate of 91.8%. Similarly, the employment rate was 90% for STEM international graduates, even though a third of international graduates studied STEM.
Table A: Highest employment rates by study area for international graduates
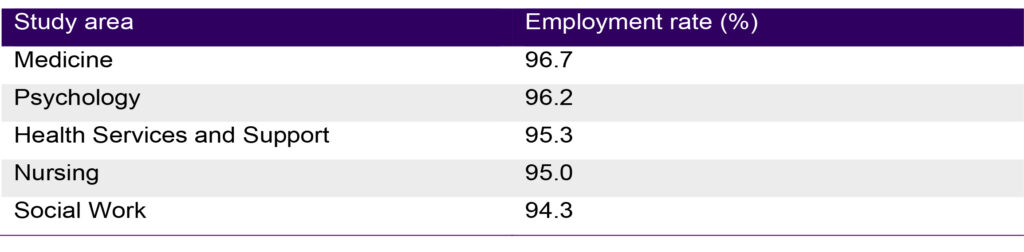
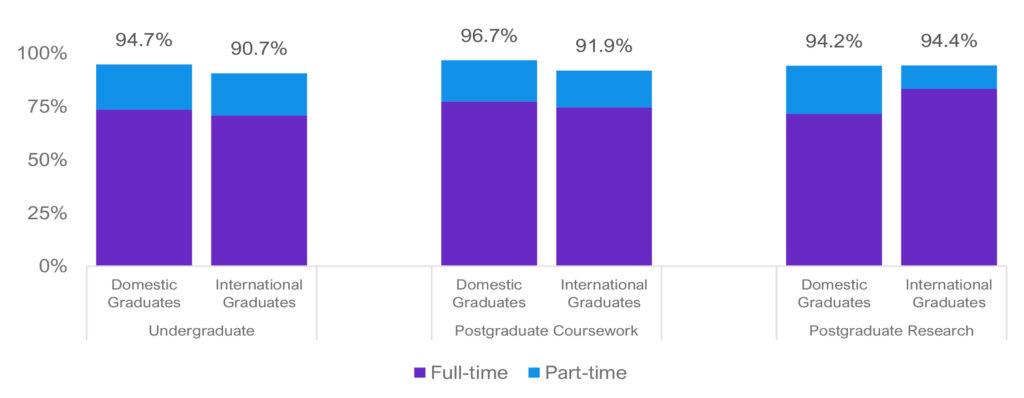
Figure B shows that three years after completing their studies, domestic graduates at both the undergraduate and postgraduate coursework levels had better employment rates, 4.0 percentage points (pp) and 4.8pp higher than international graduates respectively. At the postgraduate research level, both cohorts had an employment rate of just over 94.0%, but over double the proportion of domestic graduates reported working part-time (24.1%) compared with international graduates (11.7%). Overall, international graduates were almost as likely to be part-time as domestic graduates with approximately one in five graduates working part-time.
Figure B: Domestic graduate and international graduate employment rates by coursework level
Demographic labour market trends
The employment rate of international graduates was 91.7%, 3.7pp lower than the rate for domestic graduates (see Table B). The participation rate was similar between the international and domestic cohorts, differing by 0.5pp. Female domestic graduates have been slightly more competitive in the labour market, with a higher employment rate of 95.6% (0.7pp higher than males). The opposite outcome was reported for international graduates with males having a slightly higher employment rate than females (difference of 0.5pp). Participation rates were higher for males than females for both domestic graduates and international graduates
Table B: Employment rates and participation rates for domestic graduates and international graduates by gender
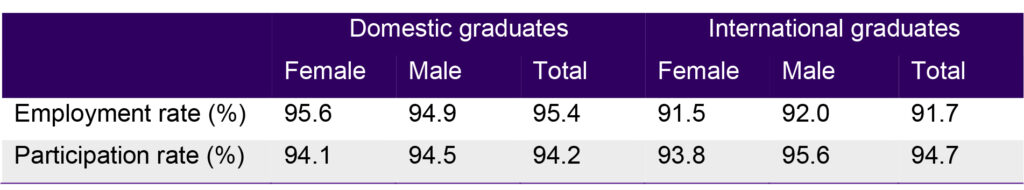
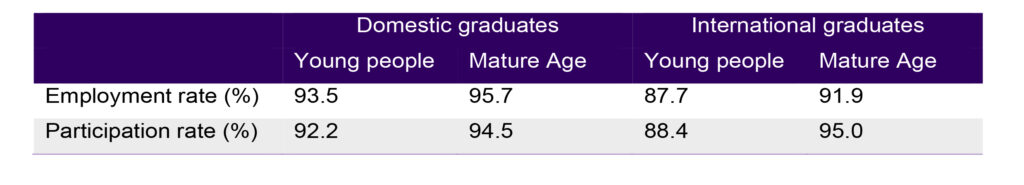
Table C shows that young domestic graduates (aged under 25 years) were more likely to be employed and were more likely to enter the labour force than their international counterparts. Employment and participation rates were higher for mature age graduates compared to young people for both domestic and international graduates. The employment gap between the two age groups was 4.2pp for international graduates and 2.2pp for domestic graduates. Likewise, the participation rate for mature age international graduates was 6.6pp higher than for young people. This gap was 2.3pp for domestic graduates.
Table C: Employment rates and participation rates for domestic graduates and international graduates by age group
Over-qualification and underemployment
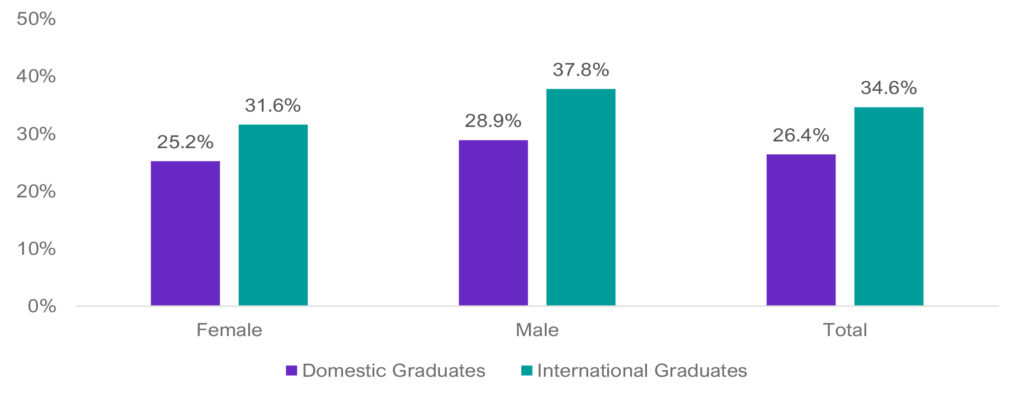
The GOS-L survey asks respondents a series of questions about whether their skills, abilities and education are commensurate with their current job. Figure C shows that international graduates were more likely than domestic graduates to perceive themselves as being over-qualified for their job at the time of survey. Female graduates were less likely to feel over-qualified, and the difference between genders was 3.7pp for domestic graduates and 6.2pp for international graduates.
Figure C: Percentage of domestic graduates and international graduates who perceived themselves as over-qualified by gender
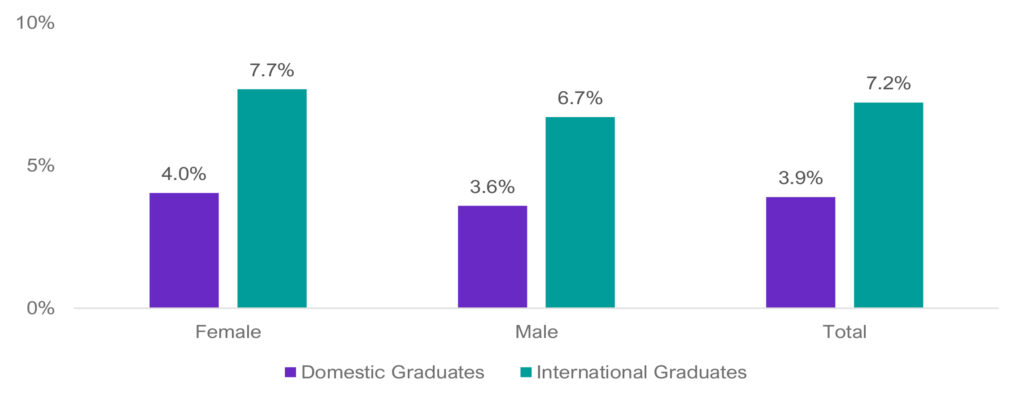
As seen in Figure D, female graduates were slightly more likely to be underemployed than their male counterparts for both international and domestic graduates (1.0pp or less difference). For both genders, international graduates had higher underemployment rates that were nearly two times that of domestic graduates. The gap for male domestic and international graduates was 3.1pp and for females it was 3.7pp.
Figure D: Underemployment rate of Domestic Graduates and International Graduates by gender